MapCore is GridMap’s AI-powered mapping platform that
uses machine learning (ML) to automate how maps are built, updated, and extended. I worked as the
Lead UX Designer on the developer platform that helps engineers and data scientists visualize,
validate, and manage the geospatial data that powers MapCore.
My focus was continuous UX improvements across complex workflows, improving visualization
clarity, and making it faster and easier for technical users to work with dense data and
analytics. The goal was to improve speed, accuracy, and accessibility while supporting scale
across global teams.
As MapCore expanded, new tools and automation features were introduced frequently.
Every new capability improved functionality, but it also increased risk: more controls, more
data layers, more configuration, and more cognitive load.
At the platform level, we also had broader usability challenges: fragmented workflows,
laborious editing steps, and difficulty verifying AI-driven updates in dense geospatial views.
Before redesigning workflows or introducing new UI patterns,
I needed to understand where friction actually existed in real developer behavior.
I conducted stakeholder interviews across product and engineering to clarify current
priorities, upcoming AI enhancements, and known areas of friction. Stakeholders provided me
insight into feature growth and automation improvements.
To ground the work in user behavior, I conducted several rounds of user interviews with engineers and
data specialists using the platform regularly. I asked broad satisfaction and usability
questions, while also focusing on how they completed common tasks such as validating
ML-driven map updates, editing JSON configurations, and isolating specific data layers.
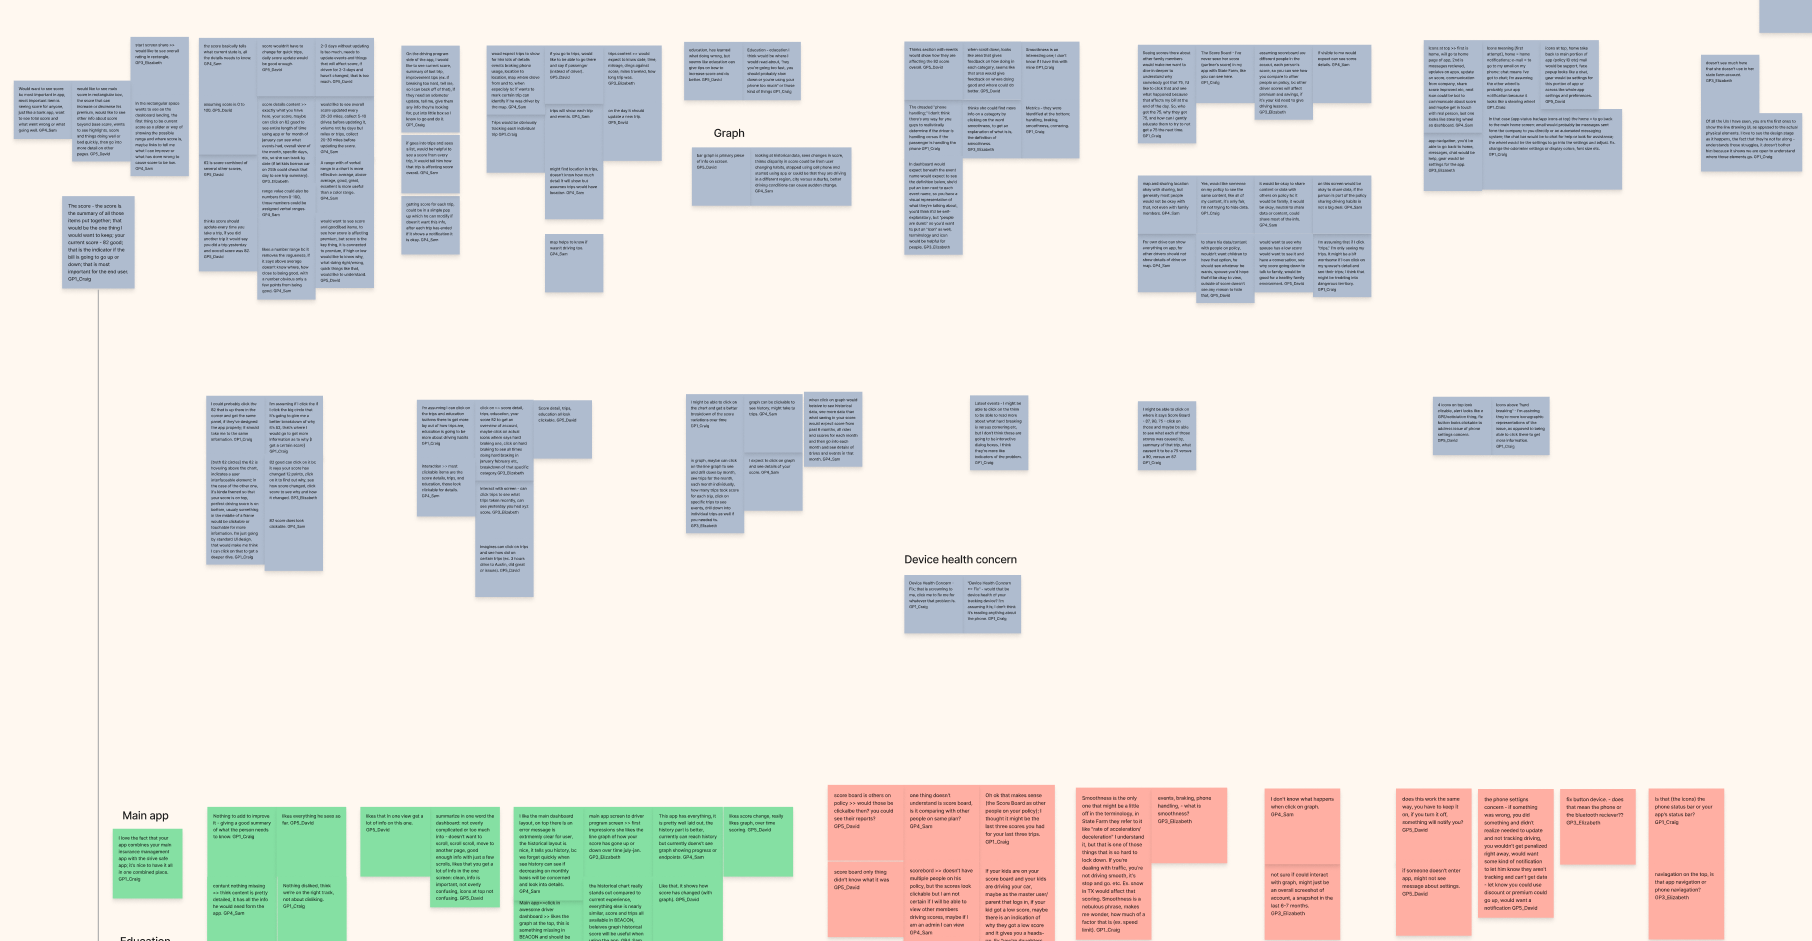
Several details emerged:
I also reviewed support tickets and internal issue logs to identify recurring
pain points. This helped validate that the friction points observed in interviews were not
isolated cases but systemic usability challenges.
This insight shaped the design direction. Instead of simplifying the platform by removing
depth, I focused on restructuring how and when complexity was exposed. The goal became
reducing friction in high-frequency workflows while preserving advanced functionality for
power users.
Problem: Rapid feature growth created complexity and decision fatigue.
Organized features by task relevance and surfaced controls contextually when needed.
Advanced settings were placed in expandable panels so power users could access depth without forcing
it on every workflow. I also partnered with engineers to review new features before release to keep
usability from drifting as capabilities increased. This allowed feature growth without overwhelming
users.
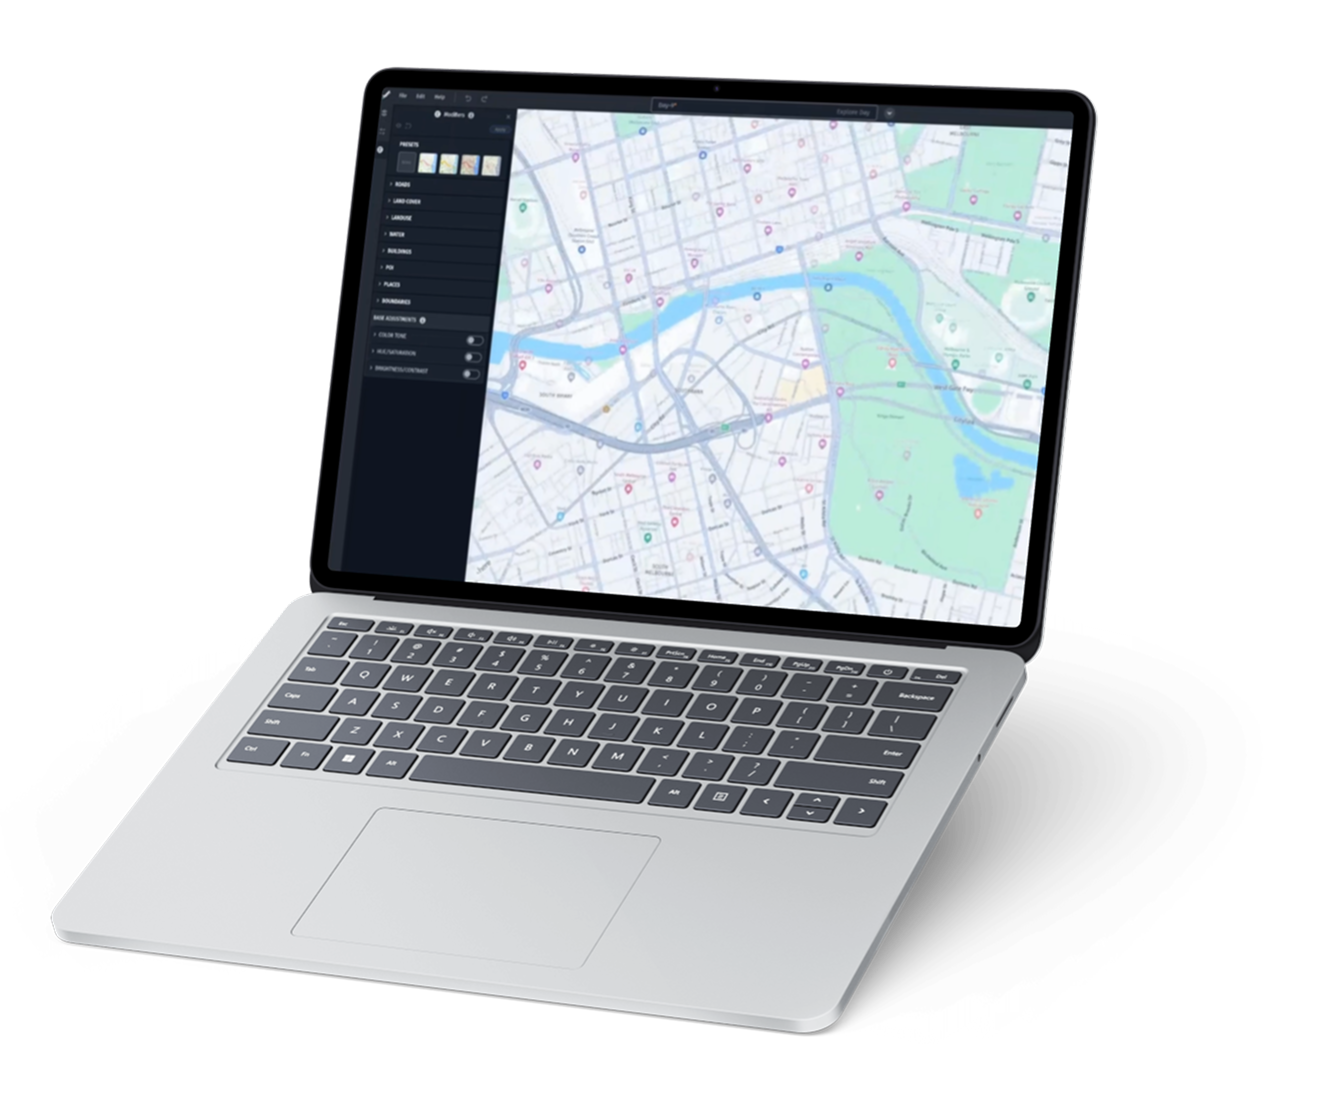
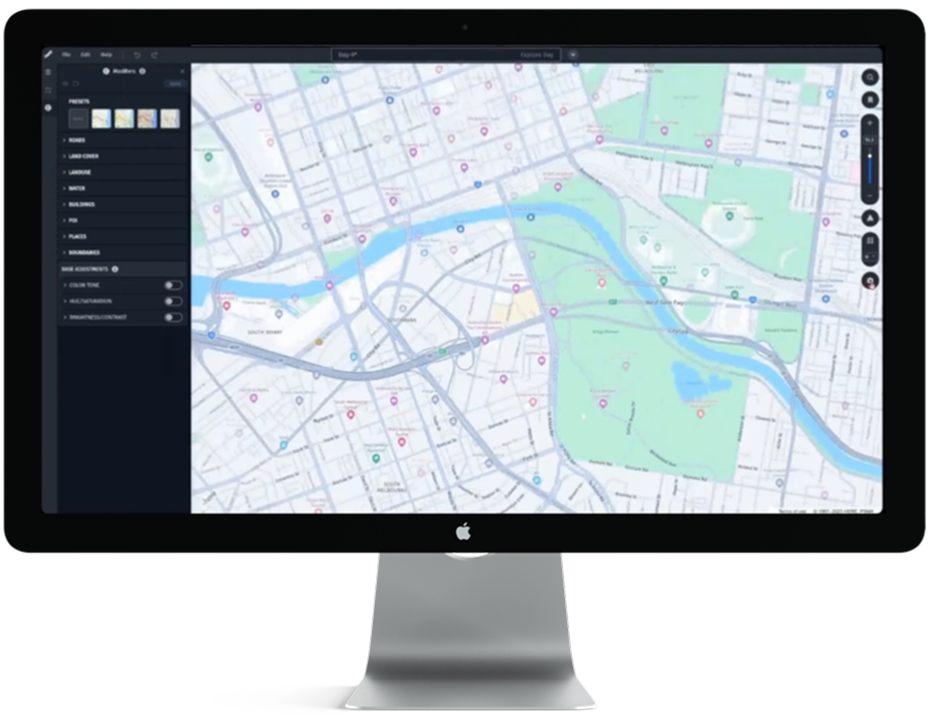
Problem: Dense map data made it hard to interpret changes.
Improved layer filtering and visibility controls with customizable toggles,
color safe data states, and zoom adaptive clustering to clarify differences and reduce
visual noise. This improvements made complex geospatial changes easier to read and understand.
Problem: Styling relied on large, clunky JSON files
Designed a modular JSON editing approach in the UI so developers could isolate and
modify specific sections like roads, buildings, or environmental layers without re-importing
entire files. This reduced load time, lowered version conflict risk, and made updates faster
and more accurate in production workflows.
Working on MapCore reinforced how much technical innovation depends on
clear, human centered UX. Even the most advanced AI driven systems rely on usability,
accessibility, and workflow clarity to be effective.